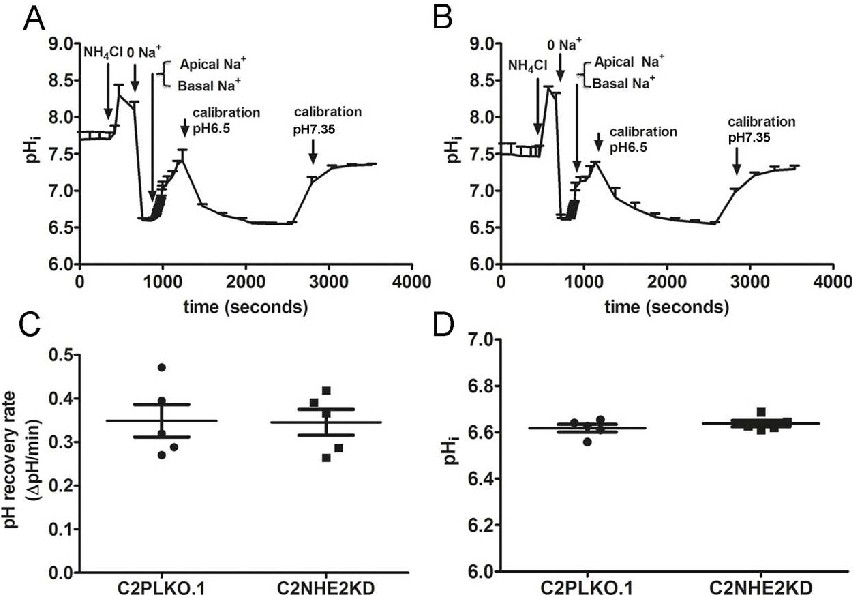
Fig. 7. Acid-activated total Na+/H+ exchange rates in differentiated C2PLKO.1 andC2NHE2KD cells. Both apical and basal sides of the cell monolayer were perfused with Na+-containing solution without inhibitors. (A) pHi recovery curve in C2PLKO.1 cells, (B) in C2NHE2KD cells. (C) Comparison of acid-activated Na+/H+ exchange rates in C2PLKO.1 and C2NHE2KD cells. (D) Comparison of initial pHi at the beginning of acid-induced pHi recovery. (n=5, mean ± SEM).